THE GENERATIONAL RESET
This document sits in Section Four — The Context — because demographics is not primarily a spending question or a political structure question. It is the slow-moving physical reality within which every other policy question must be answered. The age structure of the population determines who pays taxes and who draws on public services. The fertility rate determines whether there are enough future contributors to sustain commitments made today. The regional distribution of people shapes housing demand, infrastructure need, and political voice. None of these dynamics are the result of a single policy choice. All of them can be shaped — or ignored — by policy. The Generational Reset argues they cannot be ignored any longer.
Executive Summary
The United Kingdom has an ageing population, a sub-replacement fertility rate, a heavily skewed geographic distribution of people, and a growing gap between the wealth held by older generations and the prospects available to younger ones. None of this is new information. All of it is consistently underweighted in public debate.
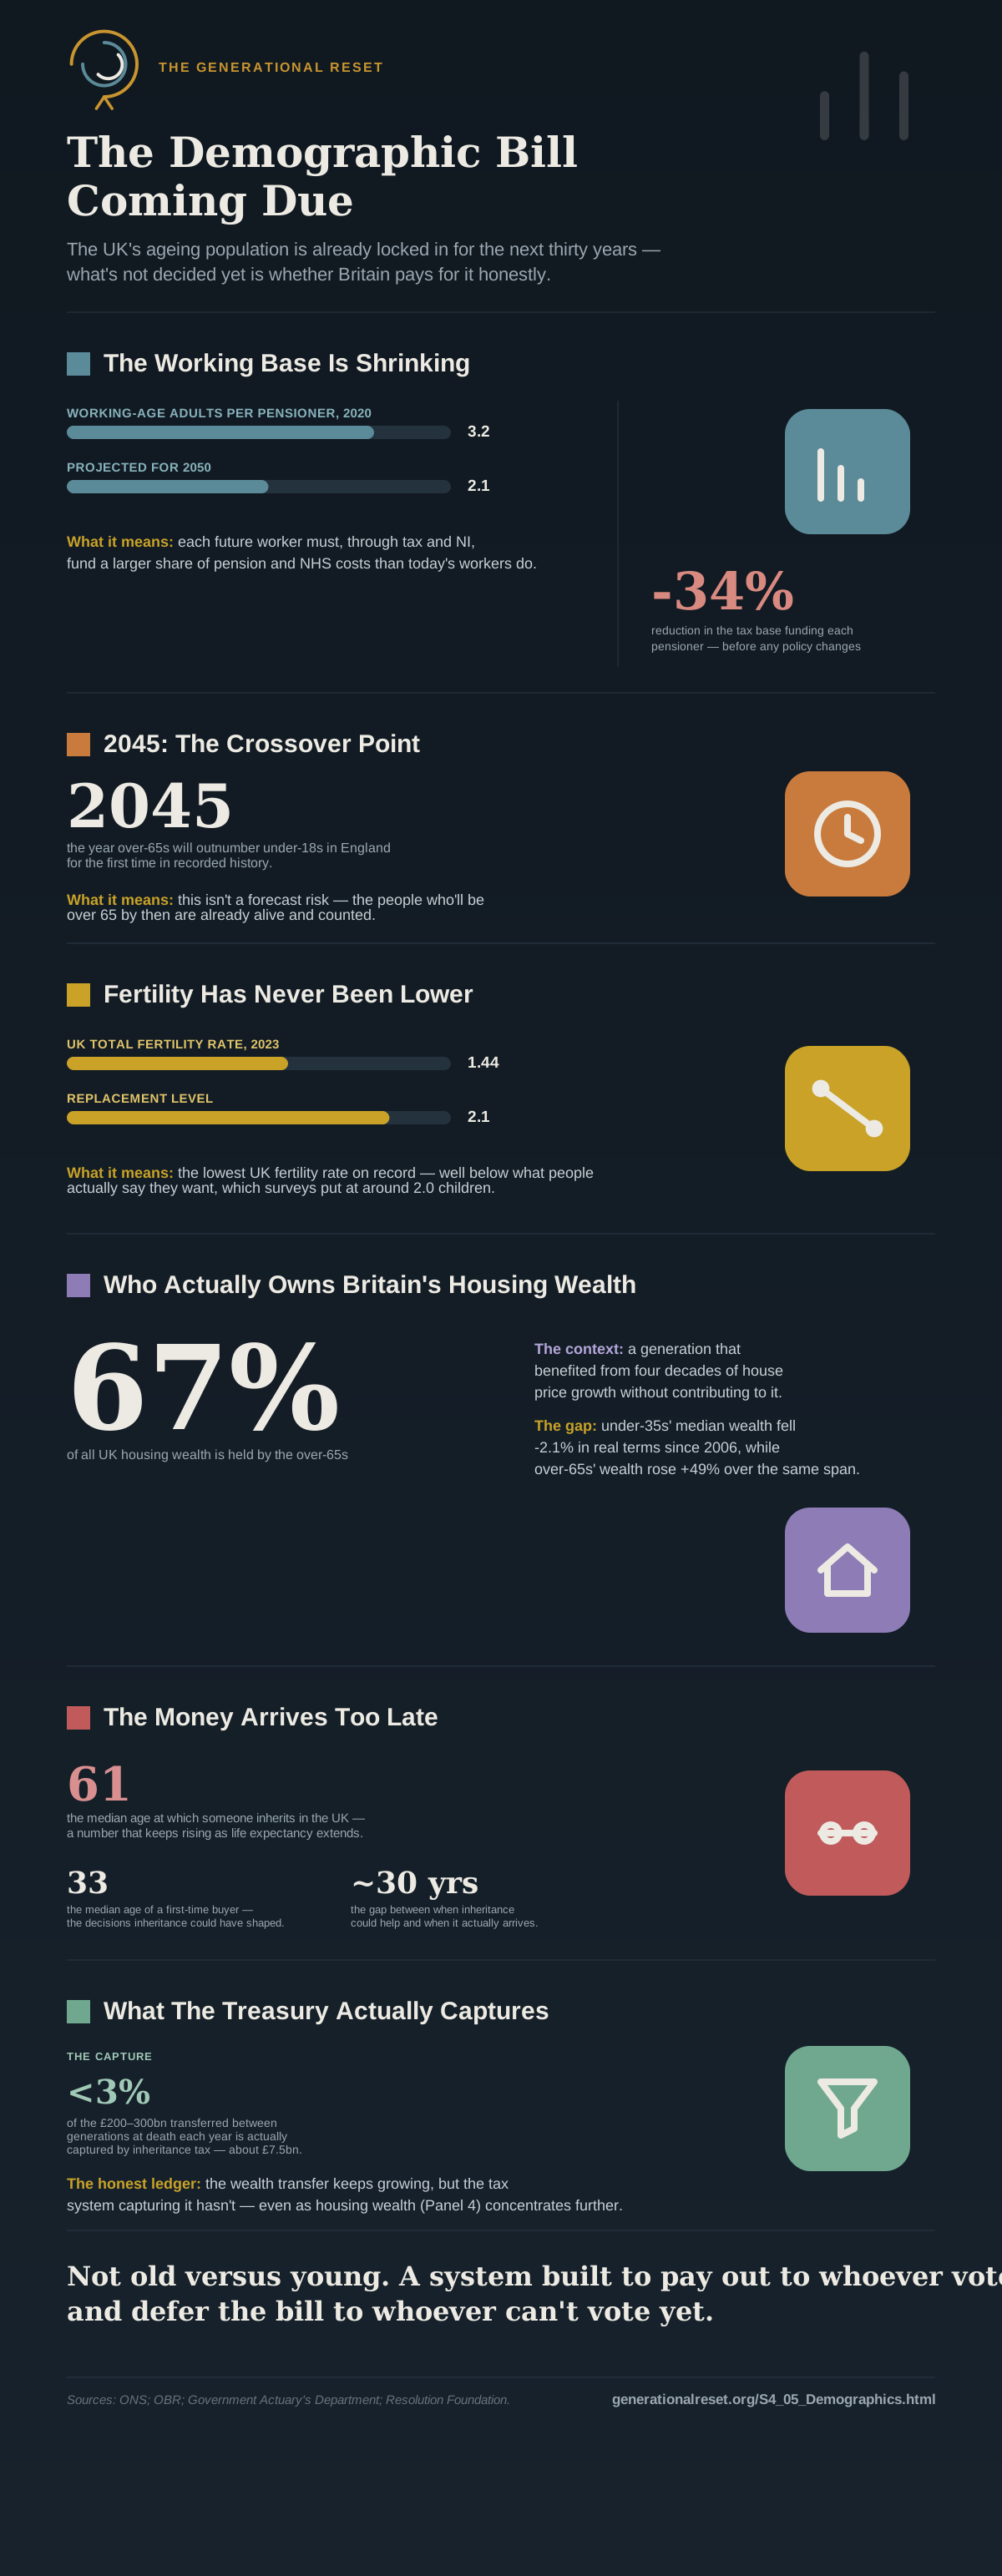
The UK fertility rate stood at 1.44 in 2023 — the lowest recorded since national statistics began in 1938, and well below the 2.1 replacement level. The population is ageing: by 2045 there will be more people aged over 65 than under 18 in England for the first time in history. The old-age dependency ratio — the number of working-age adults per pensioner — was 3.2 in 2020 and is projected to fall to 2.1 by 2050. The state pension costs £146.5 billion per year. The NHS and social care costs are projected to rise from a combined 9.0% of GDP today to over 15% by the 2070s, driven almost entirely by demographics.
These numbers are not a crisis in themselves. They are a set of structural conditions that require honest policy responses. The honest responses are not being made. Instead, the political system is making short-term transfers to the group with the most electoral power — older, asset-owning voters — while deferring the structural consequences to younger generations who have less political voice, fewer assets, and a lower probability of ever matching the living standards their parents achieved.
The geographic picture compounds the demographic one. England's population is concentrated in a way that creates structural imbalances in housing demand, infrastructure provision, and political representation. The South East absorbs growth that the planning system will not accommodate. Post-industrial regions carry ageing populations with shrinking working-age bases and weakening local economies. These are not natural outcomes. They are the accumulated result of decades of underinvestment in regional infrastructure and an economic model that reinforces concentration.
This pillar does not propose a single demographic policy. Demographics cannot be reformed the way a tax system or an electoral system can. What it proposes is that no other pillar in this project can be read honestly without understanding the demographic context it operates within — and that the political choices being made today on welfare, housing, NHS funding, immigration, and public debt are all, at their core, demographic choices about who bears costs and who receives benefits across generations.
One framing of these problems is generational — old versus young, pensioners versus working-age adults. That framing is wrong, and this pillar explicitly rejects it. The majority of pensioners are not wealthy. Approximately 1.9 million live in poverty. The average state pension is around £11,500 a year. The argument here isn't that older people have taken too much — it's that a specific transfer of wealth, driven by four decades of asset price appreciation in property, by a tax system that protects accumulated capital while taxing labour heavily, and by an inheritance architecture that captures less than 3% of the largest generational wealth transfer in British history, has flowed overwhelmingly to a wealthy minority. The political system has responded to that minority's interests as though they were the interests of older people as a whole. The target of this analysis is a system, not a generation.
Key Proposals
Recycle a high inheritance tax into early-life public goods as demographic policy. Housing, childcare, and a citizen's endowment, moving capital from the point in the life cycle where it can no longer influence family formation to the point where it determines whether family formation is financially viable.
Close the healthy life expectancy gap rather than set a fertility or demographic target. Housing, childcare, employment, and welfare reforms that remove the structural barriers to family formation and extend working lives, with honest accounting for the fiscal consequences of current demographic trends.
1. Population Structure — What the Data Shows
1.1 Fertility — The Floor Keeps Falling
The UK total fertility rate (TFR) has been below replacement level since 1973. That is not new. What is new is the pace and depth of recent decline. In 2010 the TFR was 1.92 — still below replacement but stable enough that policy conversations about long-run population trajectory were deferred. By 2023 it had fallen to 1.44, a drop of 0.48 in thirteen years with no reversal in sight.1
The causes are structural and familiar across developed economies: later family formation as the cost of housing delays household independence; high childcare costs relative to wages; precarious employment among the age group most likely to have children; and a growing gap between the number of children people say they want — consistently around 2.0 in surveys — and the number they actually have. The gap between intended and actual fertility is itself a policy signal: people are not choosing smaller families as a preference. They are being priced out of the families they want.
| Country | Total Fertility Rate (2023) |
|---|---|
| UK | 1.44 |
| Germany | 1.36 |
| Spain | 1.19 |
| Italy | 1.20 |
| France | 1.68 |
| Sweden | 1.45 |
| Netherlands | 1.49 |
| Norway | 1.40 |
| USA | 1.62 |
| Replacement level | 2.10 |
The UK is not an outlier on fertility — it sits in the middle of a Europe-wide decline. France and the USA are higher, but both have seen significant falls since 2010. No major developed economy is at replacement. The relevant question is not why the UK is unusual but what a sustained sub-replacement fertility rate means for fiscal architecture — and that question is answered the same way everywhere: fewer future contributors per current recipient.
1.2 Ageing — The Structural Shift
An ageing population is the arithmetic consequence of sub-replacement fertility combined with rising life expectancy. The UK life expectancy at birth is 79.0 years for men and 82.9 for women2, both having risen substantially over the past fifty years. Longer lives are an achievement, not a problem. The fiscal challenge arises because the welfare, health, and social care systems were designed around a demographic structure that no longer exists — and are being maintained by a political class that has not updated either the systems or the honest public account of what they cost.
The old-age dependency ratio is the most important single demographic number in UK public finance. In 1970 there were approximately 4.5 working-age adults for every person over 65. By 2000 that had fallen to 3.8. In 2020 it stood at 3.2. By 2050 it is projected by the ONS to reach 2.1.3 Each of those working-age adults must, through taxation and National Insurance, fund a larger share of pension, healthcare, and social care costs than the generation before them.
1.3 Life Expectancy Divergence — The Inequality Hidden in the Average
The headline life expectancy figure conceals a divergence that is both morally significant and fiscally important. In the most deprived decile of English communities, male healthy life expectancy — the years lived without a limiting illness — is approximately 52 years. In the least deprived decile it is approximately 70 years. That is an 18-year gap in healthy life expectancy within the same country, broadly tracking deprivation.
The fiscal consequence is direct. People in deprived communities draw on the NHS, social care, and disability benefits for a longer proportion of their lives relative to the years they contribute in employment and taxation. They are not choosing to do this. They are the downstream consequence of decades of underinvestment in housing quality, air quality, diet and food environment, primary care provision, and employment conditions in post-industrial regions. The Healthy Life Expectancy gap is not a health statistic. It is an inequality statistic that happens to manifest in health outcomes.
2. Generational Wealth — A Transfer System Running in Reverse
2.1 The Asset Price Revolution and Who Captured It
Between 1990 and 2024, UK house prices rose by approximately 470% in nominal terms and 230% in real terms. In the same period, real median wages grew by approximately 30%.5 The divergence between asset price growth and income growth is the defining economic event of the past thirty years — and it has redistributed wealth between generations in a way that policy has not addressed and political debate has almost entirely avoided.
Those who were already property owners in 1990 captured the majority of that appreciation passively — without working for it, investing in productive activity, or paying meaningful tax on the gain. Those who reached working age after 1990 have faced housing costs that absorb an increasing share of income, reducing their capacity to save, to accumulate assets, and to build the financial resilience that previous generations achieved through homeownership at lower multiples of income.
| Metric | Data |
|---|---|
| Median UK house price (1990) | ~£54,000 |
| Median UK house price (2024) | ~£285,000 |
| Real terms increase (1990–2024) | +230% |
| Real median wage increase (1990–2024) | +~30% |
| Share of housing wealth held by over-65s | 67% |
| Homeownership rate: age 25–34 (2000) | 55% |
| Homeownership rate: age 25–34 (2024) | 27% |
| Average age of first-time buyer (2024) | 33 (34 in London) |
| Median inheritance: top estate quintile | ~£230,000 |
| Median inheritance: bottom estate quintile | ~£11,000 |
2.2 Inheritance — The Intergenerational Transfer
Total wealth passed between generations at death is estimated by the Resolution Foundation at £200–300 billion per year currently, rising to £350–450 billion annually through the 2030s and 2040s as the baby boomer cohort — the primary beneficiaries of the asset price revolution — reaches the end of life.6 This is the largest intergenerational wealth transfer in British history. The current inheritance tax system captures approximately £7.5 billion of it — less than 3%.7
The political argument that is most often deployed against reforming inheritance — that the younger generation will eventually inherit, solving the housing and wealth gap in time — collapses on three separate grounds. Each deserves to be examined directly, because the argument is repeated as though it settles the matter when in fact it describes a system that is failing the people it is supposed to reassure.
The Timing Problem
The median age at which someone inherits in the UK is now approximately 61. That number has risen steadily as life expectancy has extended — and it will continue to rise. When the state pension age was introduced in 1948, the average parent died in their late sixties. A child inheriting then was in their forties. Today, a parent dying at 85 leaves children who are in their late fifties or early sixties.
The decisions that determine the shape of a life are made between the ages of 20 and 40: whether to rent or buy, which city to live in, whether to start a business, whether to pursue further education, whether to have children and how many. An inheritance arriving at 61 does not influence any of those decisions. It arrives after the mortgage has been paid off or forgone entirely. After the children have grown up in whatever housing was available. After the career path was set by whatever capital was accessible at the time. The money reaches people who can use it to be more comfortable in retirement. It does not reach people at the moment when capital would have changed their trajectory.
The Distribution Problem
The argument that 'the younger generation will inherit' conceals an inequality within that generation that is at least as important as the inequality between generations. Inheritance does not flow evenly across the cohort that receives it. It flows to those whose parents had assets — which means it flows to the children of homeowners, not the children of renters; to the children of the professionally employed, not the children of those in low-wage work; to the children of those who accumulated property wealth, not those whose parents spent their working lives with no meaningful assets to pass on.
The children of homeowners in the South East will inherit six-figure or seven-figure estates. The children of private renters in post-industrial towns will inherit little or nothing. The children of parents who spent their final years in residential care — with fees of £5,000 a month or more consuming housing equity — will inherit materially less than they expected. Inheritance does not solve the wealth gap between the generation receiving it. It reproduces and amplifies the wealth gap that existed within the generation passing it on.
| Group | Estimated median inheritance received |
|---|---|
| Children of top wealth quintile parents | ~£230,0008 |
| Children of second wealth quintile parents | ~£68,000 |
| Children of middle wealth quintile parents | ~£24,000 |
| Children of fourth wealth quintile parents | ~£8,000 |
| Children of bottom wealth quintile parents | ~£11,000 |
| Children of private renters (all regions) | ~£0 – £15,000 |
| Children of social renters | Effectively nil in most cases |
The distributional picture is starker still when geography is added. A child inheriting a house in Guildford inherits a different quantum of wealth from a child inheriting a house in Grimsby — even if both parents spent the same share of their income on housing across their lifetimes. The planning system and the concentration of economic activity created that price differential. The inheriting generation did not. But one child captures it and one does not.
The Care Cost Erosion Problem
The third failure of the 'they will inherit' argument is one that receives almost no attention in public debate: a growing proportion of the housing wealth that the baby boomer generation accumulated — and that younger generations are told will eventually solve their problem — is being consumed by social care costs before it can be passed on.
The means test threshold for social care in England has been frozen at £23,250 since 2011. Average residential care home costs are now approximately £4,800 per month; nursing care approximately £6,200 per month. Someone entering residential care at 82 and living for three years will spend approximately £173,000 to £224,000 on fees before the state contributes anything. For those who entered without significant liquid assets, this cost is met by drawing down housing equity — the asset that was expected to form the inheritance. The wealth does not disappear. It is transferred to care providers rather than children. The practical consequence for the inheriting generation is the same: the inheritance they were told was coming is substantially smaller or absent.
The Dilnot Commission identified this problem in 2011 and proposed a lifetime care cost cap of £35,000, above which the state would meet costs. That reform was legislated in 2014, delayed in 2015, promised again in 2021, revised to a £86,000 cap in 2022, and abandoned in 2024. Thirteen years of inaction on a known, quantified problem. In the intervening period, hundreds of thousands of families have seen housing wealth earmarked for inheritance consumed by care fees instead — not because of any deliberate policy, but because no government chose to fix the system.
2.3 The Two Top 1%s — Wealth and Income Are Different Populations
The "top 1%" is not one group. The top 1% by income (£207,000 a year, based on approximately 367,000 of 36.7 million taxpayers) and the top 1% by wealth (approximately £3.6 million in net worth) describe structurally different, and structurally older, populations.9 ONS Wealth and Assets Survey data shows median household wealth peaks at ages 65–74, driven by property (around 40% of total wealth) and pension wealth (around 35%) — both of which mechanically accumulate with age and time. One analysis of the same data found the top 10% of the wealth distribution dominated by those aged 55 and over: a 35-year-old with a £400,000 London flat sits around the 70th wealth percentile, while a 65-year-old with the same flat mortgage-free, plus a comparable pension, is comfortably in the top 5%.10
This is why "the top 1% pay 28% of income tax" and "wealth is concentrated among older cohorts" are not competing claims — they're measuring different things. Income tax concentration says almost nothing about the age-cohort wealth gap this pillar's fertility and inheritance-timing argument depends on.
2.4 The Fertility Consequence — How the Timing Problem Suppresses the Next Generation
The three failures of the inheritance argument — timing, distribution, and care cost erosion — do not only fail the generation that fails to receive it in time. They actively suppress the generation that might have existed. This connection is almost never made in public debate, and it is the most structurally important consequence of the current system.
The decisions about whether to have children, and how many, are made overwhelmingly between the ages of 25 and 40. They are made in the same window in which housing costs are at their most prohibitive, childcare costs are at their highest relative to income, and financial uncertainty is at its greatest. Survey data consistently shows that people in the UK want on average around two children. The actual fertility rate is 1.44. The gap between intended and actual fertility is not a preference. It is a financial constraint — and housing cost is its primary expression.
The inheritance that might have contributed to resolving that constraint — providing a deposit that converts renting to owning, reducing housing cost, creating the financial stability that makes a second or third child feel viable — arrives at 61. The fertility window has closed. The family that might have existed did not exist, not because the parents chose against it, but because the capital that would have enabled it was held in assets controlled by the generation above and transferred thirty years too late.
This creates a self-reinforcing demographic spiral that the current inheritance system actively sustains. Sub-replacement fertility is partly driven by the financial barriers to family formation. Those barriers are partly a function of wealth being locked in property held by older generations rather than accessible to younger ones at the moment it would matter. Fewer children means a smaller future working-age population. A smaller working-age population means a weaker tax base. A weaker tax base means less fiscal capacity to fund the childcare, housing, and public services that would make having children more affordable. Which suppresses fertility further.
It is important to be precise about what this argument is and is not. The Generational Reset does not propose a fertility target. It does not propose natalist policy — the state telling people how many children to have. What it proposes is the removal of the financial barriers that explain the gap between the families people say they want and the families they are able to have. That's a materially different proposition: the state ceasing to structurally subsidise a system that prevents people from living the private life they'd choose, rather than the state directing private life itself.
The Resolution Foundation projects that by 2035 inherited wealth will account for a larger share of lifetime income for the average UK adult than earnings growth — the first time this has been projected in British history. If that projection is correct, then the primary determinant of living standards in the United Kingdom will no longer be what people earn through their own effort and ability. It will be what their parents happened to accumulate through an asset price boom they did not engineer. That is not a market outcome. It is a policy outcome — the product of specific choices about taxation, planning, and public investment that can be made differently. The demographic consequences of not making them differently are already visible in the fertility data.
Recycling a high inheritance tax at death into early-life public goods — housing, childcare, and a citizen's endowment — is this pillar's own proposed use for a share of that revenue, understood as demographic policy as much as fiscal policy. It moves capital from the point in the life cycle where it can no longer influence family formation to the point where it determines whether family formation is financially viable. It does not compel anyone to have children. It removes the financial constraint that is currently preventing people from having the children they say they want. It is not part of the Economic Renewal pillar's own financing plan: that pillar's §4.1 allocates the full projected inheritance tax revenue to closing the gap left by replacing income tax, with nothing left over on this project's own numbers. This proposal is therefore honestly unfunded within the current model — a statement of what this pillar believes a share of that revenue should eventually go toward, not a costed commitment.
UK total fertility fell from 1.92 in 2010 to 1.44 in 2023 — a drop of 0.48 in thirteen years with no reversal in sight — against survey evidence that people want on average around two children.1 UK house prices rose approximately 470% in nominal terms (230% real) between 1990 and 2024, against roughly 30% real wage growth over the same period.5 Median inheritance arrives at age 61 — after the 25-to-40 window in which most family formation decisions are actually made.
A gap between the family size people say they want and the family size they actually have is consistent with a financial constraint, but the timing mismatch is what turns inheritance specifically into part of that constraint rather than part of the solution — this is this project's own connecting argument, not a finding any single source states on its own. Capital that could fund a deposit or absorb childcare costs during the fertility window instead arrives roughly two decades after that window has closed for most recipients, which is why the wealth existing at all doesn't resolve the constraint the way its scale might suggest it should.
The causation above is compatible with responses other than recycling inheritance earlier: treat the fertility gap as substantially a preference shift rather than a financial constraint, in which case no transfer-timing fix would close it; address the financial constraint through housing supply alone — building enough homes to bring prices down directly — without touching how or when wealth transfers between generations; adopt direct pronatalist incentives (cash payments, tax breaks tied to having children) on the model some European governments use, rather than a general early-life capital transfer with no fertility condition attached; or, as this pillar proposes, remove the timing mismatch by recycling a share of inheritance tax revenue into early-life goods, without directing family size at all.
Choosing an unconditional early-life transfer over direct pronatalist incentives reflects a value judgement this pillar makes explicitly: that removing a financial barrier to a choice people already say they want is legitimate, while the state directly incentivising or conditioning support on family size is not — even though a conditional incentive might move the fertility rate more directly and cheaply than a general transfer would. A reader who judges that the fertility gap is substantially preference-driven rather than financial, or who would accept direct pronatalist incentives as a more targeted tool, is not wrong on the evidence; they are weighing the same data against a different view of what's driving the gap and what the state should do about it.
Recycle a share of inheritance tax revenue into early-life public goods — housing, childcare, a citizen's endowment — delivered during the 25-to-40 window rather than at the point of death, per P1 above. The falsification test below is what would show the timing mismatch, not preference, is genuinely the binding constraint on fertility.
3. Geographic Distribution — The Country Within the Country
3.1 The Concentration Problem
England is not evenly populated, and the imbalance is growing. London and the South East generate approximately 39% of national GDP, up from 36% in 2005. That concentration is partly a natural consequence of agglomeration economics — cities produce more because they bring together labour, capital, and knowledge in ways that dispersed areas cannot. But the UK's concentration is extreme by international comparison: the London–rest of country productivity gap is larger than the equivalent gap in Germany, France, the Netherlands, or any other comparable European economy.
The demographic dimension of this is specific. The regions outside London and the South East have older populations, higher rates of economic inactivity, lower life expectancy, higher rates of disability, and lower average earnings. They also have weaker fiscal positions — lower tax revenues per head and higher welfare costs per head — precisely because they carry a higher proportion of the demographic groups that generate high public costs. This is not a moral failing. It is the structural geography of an economy that has concentrated opportunity for decades and is now paying the compounding fiscal cost of that choice.
| Region | Median age │ GVA per head │ Healthy life expectancy (men) |
|---|---|
| London | 37.0 │ £60,500 │ 64.9 years |
| South East | 41.2 │ £33,800 │ 64.3 years |
| East of England | 41.8 │ £29,200 │ 63.6 years |
| South West | 44.1 │ £26,000 │ 64.4 years |
| East Midlands | 41.3 │ £25,400 │ 62.8 years |
| West Midlands | 39.3 │ £25,900 │ 61.4 years |
| Yorkshire & Humber | 40.5 │ £24,100 │ 61.6 years |
| North West | 39.7 │ £25,600 │ 61.3 years |
| North East | 41.4 │ £22,300 │ 60.0 years |
| Wales | 42.5 │ £21,800 │ 61.9 years |
3.2 Internal Migration and What It Reveals
The UK experiences significant internal migration — people moving between regions for work, housing affordability, and quality of life. The net flow has been consistently from regions outside London and the South East into them, particularly among working-age adults aged 22–35. This selective migration has a fiscal logic: opportunity concentrates in high-productivity areas, so working-age people follow it. The consequence is that regions losing working-age migrants simultaneously lose tax base and retain ageing populations, compounding the dependency ratio problem at the regional level.
The South West illustrates a different pattern: net inward migration of older people retiring to coastal and rural areas, combined with net outward migration of younger working-age adults priced out of local housing markets. The result is the highest median age of any English region outside the specifically rural, and housing markets where retirement demand crowds out the provision of starter homes that would allow local young people to stay.
4. The Fiscal Consequence — What the Demographics Cost
4.1 The OBR Long-Run Projection
The Office for Budget Responsibility publishes a long-run fiscal sustainability report approximately every five years. Its projections are sobering. Under unchanged policy, the OBR's central case puts public debt at around 200% of GDP by the mid-2070s — down from the 270%+ it was projecting just a year earlier, though its own sensitivity testing finds almost every plausible variation on that central case still ends up on an unsustainable path — driven primarily by age-related spending growth. NHS costs are projected to rise from 7.6% to 12.2% of GDP. Social care from 1.4% to 3.5% of GDP. Pension costs from 5.1% to 7.9% of GDP. Each of these projections is driven by demographics, not by waste or mismanagement or any specific policy failure. It is simply the cost of an ageing society with the current entitlement structure.
The OBR's own sensitivity analysis shows that the trajectory changes materially under different assumptions. Higher productivity growth reduces the debt path. Higher net migration reduces it. Lower fertility accelerates it. The projection is not a forecast — it is a statement of what happens if nothing structural changes. It is published precisely to create the political pressure for structural change. That pressure has not produced structural change, because the political system rewards short-term responses to high-turnout demographics over long-run fiscal responsibility.
4.2 The Dependency Ratio and the Tax Base
Every structural reform proposed in the Generational Reset — investment in the NHS, social care, education, housing, criminal justice — depends on a tax base capable of funding it. That tax base is determined by the number of working-age contributors relative to the number of non-contributing dependants. As the dependency ratio falls from 3.2 to 2.1 over the next thirty years, the burden on each working-age adult rises by over 50% for an equivalent level of public expenditure — even before any expansion of services.11
This is the structural argument behind the immigration pillar's 'two lever' framing. GDP grows either from more workers or from each worker producing more. In a low-productivity economy with a falling dependency ratio and a sub-replacement fertility rate, both levers are under pressure simultaneously. Any credible fiscal plan must address this arithmetic honestly — including whether immigration policy is sustainable at the levels that politicians across the spectrum are competing to reduce.
5. What Policy Can and Cannot Change
5.1 What Cannot Be Changed
The demographic structure of the next twenty to thirty years is already determined. The people who will be over 65 by 2045 are alive now, and their ages are known. The working-age population of 2040 is the cohort currently in school. Short of dramatic and implausible changes in fertility or radical life extension technology, the broad shape of the dependency ratio through 2050 is fixed. Policy cannot undo this.
This isn't a counsel of despair so much as a statement of the problem's character: a known structural adjustment requiring honest institutional responses, not a crisis any single policy lever can manage away. The countries that have handled comparable transitions best — Japan, Germany, the Nordic states — have done so not by reversing their demographics but by building institutions capable of managing an ageing society without catastrophic fiscal consequences.
5.2 What Can Be Changed — and What the Evidence Shows
Fertility policy has a poor track record in developed economies. Countries that have tried direct financial incentives — baby bonuses, extended parental leave, childcare subsidies — have seen at best modest and temporary increases in TFR. The most effective interventions appear to be those that reduce the structural barriers to family formation rather than those that reward childbirth: affordable housing that allows young adults to form independent households; accessible, affordable childcare that makes dual-income parenting economically viable; and employment conditions that do not penalise career interruption for childrearing. These are not fertility policies. They are social policies with a demographic dividend.
Healthy life expectancy is more tractable than fertility, and the returns are higher. Closing the 22-year healthy life expectancy gap between the most and least deprived areas would materially reduce NHS demand, reduce disability benefit caseloads, and extend the working lives of people in post-industrial communities who currently leave the labour market a decade earlier than their peers in more affluent areas. The investment required — in housing quality, primary care, air quality, food environment, and active labour market support — is not speculative. It is the corollary of the existing evidence on what drives the gap.
The Generational Reset does not propose a fertility policy. It proposes the housing, childcare, employment, and welfare reforms that remove the structural barriers to family formation that explain the gap between intended and actual fertility. It does not propose a demographic target. It proposes honest accounting for the fiscal consequences of current demographic trends — and the institutional reforms required to manage those consequences without imposing them disproportionately on those with the least political voice.
5.3 State Pension Age — The Honest Adjustment
The state pension age is currently 66 for both men and women, rising to 67 by 2028 and 68 by the mid-2040s under current legislation. When the state pension was introduced at 65 in 1948, average life expectancy at that age was approximately 12 additional years for men. Today it is approximately 19 years. The pension system was designed around a demographic reality that no longer exists.
Further increases in state pension age are contested because they fall unevenly across the healthy life expectancy distribution. A man in Kensington can reasonably expect to live and work healthily to 68 or beyond. A man in Middlesbrough or Merthyr Tydfil — where healthy life expectancy for men is below 60 — would be required to work beyond his healthy life expectancy before receiving a pension he may never collect. Any honest adjustment to the state pension age must be accompanied by credible reform of disability and out-of-work provision for those in poor health before pension age — otherwise it is not a reform. It is a cost transfer from the Treasury to the individuals least capable of bearing it.
6. The Political Economy of Demographics
The core dysfunction in UK demographic policy is electoral. Older voters vote more reliably, are more numerous as a share of the electorate than at any previous point in British electoral history, and have benefited disproportionately from the asset price appreciation and the welfare entitlement structure of the past forty years. Under FPTP, no governing party has an electoral incentive to alter any of this — and every incentive to protect it.
The result is a feedback loop. The political system over-rewards older, asset-owning voters. The policies it produces — the triple lock, protected housing wealth, below-cost inheritance tax, low capital gains tax on primary residences — amplify intergenerational inequality. The amplification of inequality increases the stakes for younger voters who cannot access the wealth system their parents used. Those voters, when they eventually engage with the political system, do so in a context of diminished trust in institutions that have consistently prioritised someone else. The Political Renewal pillar is the precondition for breaking this loop — not because changing the electoral system changes demographics, but because changing the electoral system changes whose interests the system must respond to.
7. The Steel Man
The mechanism really does move resources across age lines — that much is not in dispute. But the framing objection is about who the policy targets, not about what it moves. A high inheritance tax does not fall on older people as a group. Most pensioners are not wealthy: approximately 1.9 million live in poverty, and the average state pension is around £11,500 a year. The estates large enough to face this tax are concentrated among a wealthy minority within the older generation, not the generation as a whole — exactly the distinction the Executive Summary draws in rejecting an "old versus young" framing.
The tax targets concentrated wealth, wherever it sits in the age distribution, and it happens to sit disproportionately with older estates today because of how four decades of asset price appreciation worked out — not because age itself is the target. If the same concentration of wealth existed among people in their forties instead of their seventies, the same tax would apply to them. That is the actual difference between a generational policy and a wealth-concentration policy that currently has a generational shape.
8. Counter-Arguments
'The demographic situation is overstated — fertility rates will recover'
There is no evidence of recovery in any major developed economy over sustained periods. Countries that have seen temporary TFR increases have generally seen them reversed. The structural drivers — housing cost, childcare cost, labour market precarity — are not weakening. The projection risk is that the TFR falls further rather than recovers. Building policy on the assumption of recovery is not optimism. It is deferral.
'Immigration can solve the dependency ratio problem'
Immigration contributes materially to the dependency ratio but cannot resolve it alone at politically sustainable levels. The OBR's modelling shows that even at relatively high net migration, the dependency ratio falls through 2050. Immigration buys time and reduces the severity of the adjustment — it does not eliminate the need for structural reform of entitlements and spending. The Immigration pillar makes this argument in detail.
'Productivity growth can compensate for demographic decline'
In principle, yes — if each worker produces enough more, the dependency ratio matters less in fiscal terms. In practice, UK productivity growth has averaged 0.4% per year since 2008, versus 2.2% before. The OBR's scenarios show that even under optimistic productivity assumptions the long-run debt trajectory remains concerning under unchanged policy. Productivity growth is necessary but not sufficient. The Economy pillar addresses what structural change is required to make it more than a theoretical possibility.
'Older people have paid in all their lives and are entitled to what they receive'
This argument deserves a direct, respectful response. The state pension is not funded from a pot accumulated by contributions. It is a pay-as-you-go transfer from current workers to current retirees. Those who are retired today received their pensions from the taxes of today's workers. What those workers receive in retirement depends on what those who work then are willing and able to pay. This is not a criticism of those receiving pensions. It is an explanation of why the sustainability of the entitlement structure depends on the dependency ratio — and why protecting it intact requires honest engagement with the demographic arithmetic, not its suppression.
Cross-Pillar Dependencies
| Pillar | Connection |
|---|---|
| Political Renewal | Proportional representation, votes at 16, and age-stratified citizens' assemblies directly change the demographic composition of political voice. The dependency ratio problem is partly a political representation problem: those who will live longest with the consequences of current decisions have the least weight in making them. |
| Welfare | The triple lock, the state pension age, and the composition of the welfare budget between pensioners and working-age recipients are all demographic policy choices — they determine how the fiscal burden of an ageing society is distributed between generations. The welfare pillar cannot be read without the demographic context this pillar provides. On childcare specifically: Welfare's £3bn/yr universal early years commitment (funded from triple-lock reform savings) is this project's only currently-financed early-years proposal. This pillar's own childcare mention above is part of the same, currently-unfunded recycling idea as the housing and citizen's-endowment pieces, not a second financed pot — the two pillars are not in conflict, but should not be read as together funding two separate childcare programmes. |
| NHS | Age-related demand is the primary driver of NHS cost growth. The 22-year healthy life expectancy gap is simultaneously an NHS failure, an inequality failure, and a fiscal problem: closing it is the highest-return investment available in terms of reduced NHS demand and extended working-age contribution. |
| Social Care | Social care costs are almost entirely demographic — driven by the number of people over 80 and the intensity of their care needs. The projections are not uncertain. They are arithmetic. The failure to build a sustainable social care funding model is a choice to defer known costs onto future working-age taxpayers. |
| Housing | The collapse in homeownership among under-35s is a demographic event — it determines whether the generation currently renting builds the wealth base that previous generations built through property. A generation that reaches retirement without property assets and with lower pension provision creates fiscal costs that are not yet fully modelled. |
| Education | The early years are the highest-return demographic intervention available. Developmental outcomes at age five predict educational attainment, lifetime earnings, health outcomes, and welfare dependency. Investing in early years is not sentimentality. It is the most cost-effective way to expand the future working-age tax base and reduce future public costs simultaneously. |
| Immigration | Immigration is the most direct short- to medium-run lever available on the dependency ratio. The immigration pillar's core argument — that honest immigration policy must begin with an honest productivity and demographic plan — is the demographic pillar's argument applied to a specific policy domain. |
| Economic Renewal | The inheritance tax model proposed in the Economic Renewal pillar is a demographic policy as much as an economic one. The baby boomer death wave — the transfer of £200–450 billion per year through the 2030s and 2040s — is the structural moment at which intergenerational wealth transfer can either amplify existing inequality further or be partially redirected toward the public investments a younger generation needs. Correction, 21 September 2026: this pillar's own §2.4 previously attributed the "recycle into early-life public goods" idea to Economic Renewal directly — Economic Renewal's own §4.1 allocates the full projected revenue to the income-tax replacement gap and never proposes this. Now corrected to read as this pillar's own proposed use for a future share of that revenue, honestly flagged as unfunded within the current model, not a claim about what Economic Renewal itself proposes. |
| Public Debt | The OBR's long-run debt projection to ~200% of GDP by the mid-2070s is driven almost entirely by demographics. Understanding the debt trajectory requires understanding the demographic trajectory. This pillar is the analytical foundation for the Public Debt pillar's urgency. |
10. Proposals for Change
This pillar does not make reform proposals in the same way the spending pillars do — demographics itself cannot be reformed, only responded to honestly. The two proposals below are restated here for completeness, not because this pillar's contribution is primarily a proposals list; its contribution is the factual foundation the rest of the project rests on.
-
Recycle a share of future inheritance tax revenue into early-life public goods — housing, childcare, a citizen's endowment — moving capital from the point in the life cycle where it can no longer influence family formation to the point where it determines whether family formation is financially viable. Honestly unfunded within this project's current model, since Economic Renewal's own §4.1 allocates the full projected IHT revenue to closing the income-tax replacement gap.
-
Close the healthy life expectancy gap rather than set a fertility or demographic target. Housing, childcare, employment, and welfare reforms that remove the structural barriers to family formation and extend working lives, with honest accounting for the fiscal consequences of current demographic trends.
11. What the Evidence Settles
This pillar does not make reform proposals in the same way that the spending pillars do — because demographics cannot be reformed. What it does is provide the factual foundation that every other reform in the Generational Reset rests on.
The fertility rate is at a record low and the structural drivers are not easing. The population is ageing at a pace that is known, quantifiable, and underweighted in public debate. The old-age dependency ratio will fall by a third over the next thirty years regardless of any policy choice made today. The healthy life expectancy gap between the richest and poorest communities is 22 years and widening. The intergenerational wealth transfer is the largest in British history and the tax system captures less than 3% of it. The geographic distribution of economic activity is concentrating further in a small part of the country, leaving post-industrial regions with older populations, weaker fiscal bases, and greater public costs.
None of this is secret. All of it is in the published data of the ONS, the OBR, the Resolution Foundation, the Health Foundation, and the Government Actuary's Department. The failure is not analytical. It is political — a system structured to respond to the short-term demands of high-turnout demographics at the expense of the long-run interests of everyone else. The Generational Reset is a project for changing that.
The Generational Reset | generationalreset.org | Not affiliated with any political party | All documents published under open licence for public discussion and adaptation
The Generational Reset | S4_05: Demographics | For public discussion. Not affiliated with any political party. | generationalreset.org