Executive Summary
The UK's commitment to universal healthcare, free at the point of use and available to all regardless of income, is right. It was right in 1948 and it is right now. No serious argument has been made against the founding principle, and this pillar does not make one.
The principle is fine. The trouble is that Britain has never funded it properly, never fixed the failures that stop it working, and never been straight with the public about the gap between what the NHS is promised and what it can deliver.
This pillar makes five arguments. First, the NHS is underfunded compared with similar countries, and that gap is a policy choice, not an economic necessity. Second, it is also inefficient for the money it gets; underfunding and underperformance make each other worse and have to be tackled together. Third, the failure of social care is a major cause of the NHS's problems, at least where delayed hospital discharge is concerned, and more than a quarter-century of political avoidance has made it far more expensive to fix. Fourth, the immigration debate about the NHS has it backwards: the data shows immigrants use fewer services, pay in, and staff the system at a level without which it could not function. Fifth, the public has never been offered a frank conversation about how much of national income to spend on health, and how to raise it.
None of this means abandoning the NHS or charging at the point of use. It means telling the truth about costs, reforming how the system works, and finding the political courage to fund what has been promised for decades.
Key Proposals
Fund the NHS honestly. Raise per capita health spending over a defined parliamentary term toward French levels, with a published trajectory and independent verification of progress.
Bring social care into a national funding framework. Legislate a cap on lifetime care costs, raise and index the means test threshold, and fund the transition through a hypothecated social care levy.
Fund the NHS workforce plan in full. Named, verified milestones; expanded clinical placement capacity before student numbers rise; published annual retention targets tied to working conditions.
Fix the GP system structurally. Extend minimum consultation time, fund the transition away from the collapsing partnership model, and significantly expand Pharmacy First as a genuine first-contact tier.
Fix the institutional infrastructure. A statutory independent NHS Procurement Authority, NICE's independence protected in primary legislation, and an IT investment plan toward genuine interoperability.
Remove the tax subsidy for employer-provided private healthcare. End corporation tax deductibility of premiums and charge employee National Insurance on the benefit, as on cash pay, and reinvest the revenue in NHS capacity: not a ban, a level playing field.
1. The Diagnosis
The NHS isn't failing for lack of public commitment; support for it runs across all parties. It is failing because the gap between what it is promised and what it is funded to deliver has been allowed to grow, year after year, beneath a political performance that treats any frank diagnosis as betrayal.
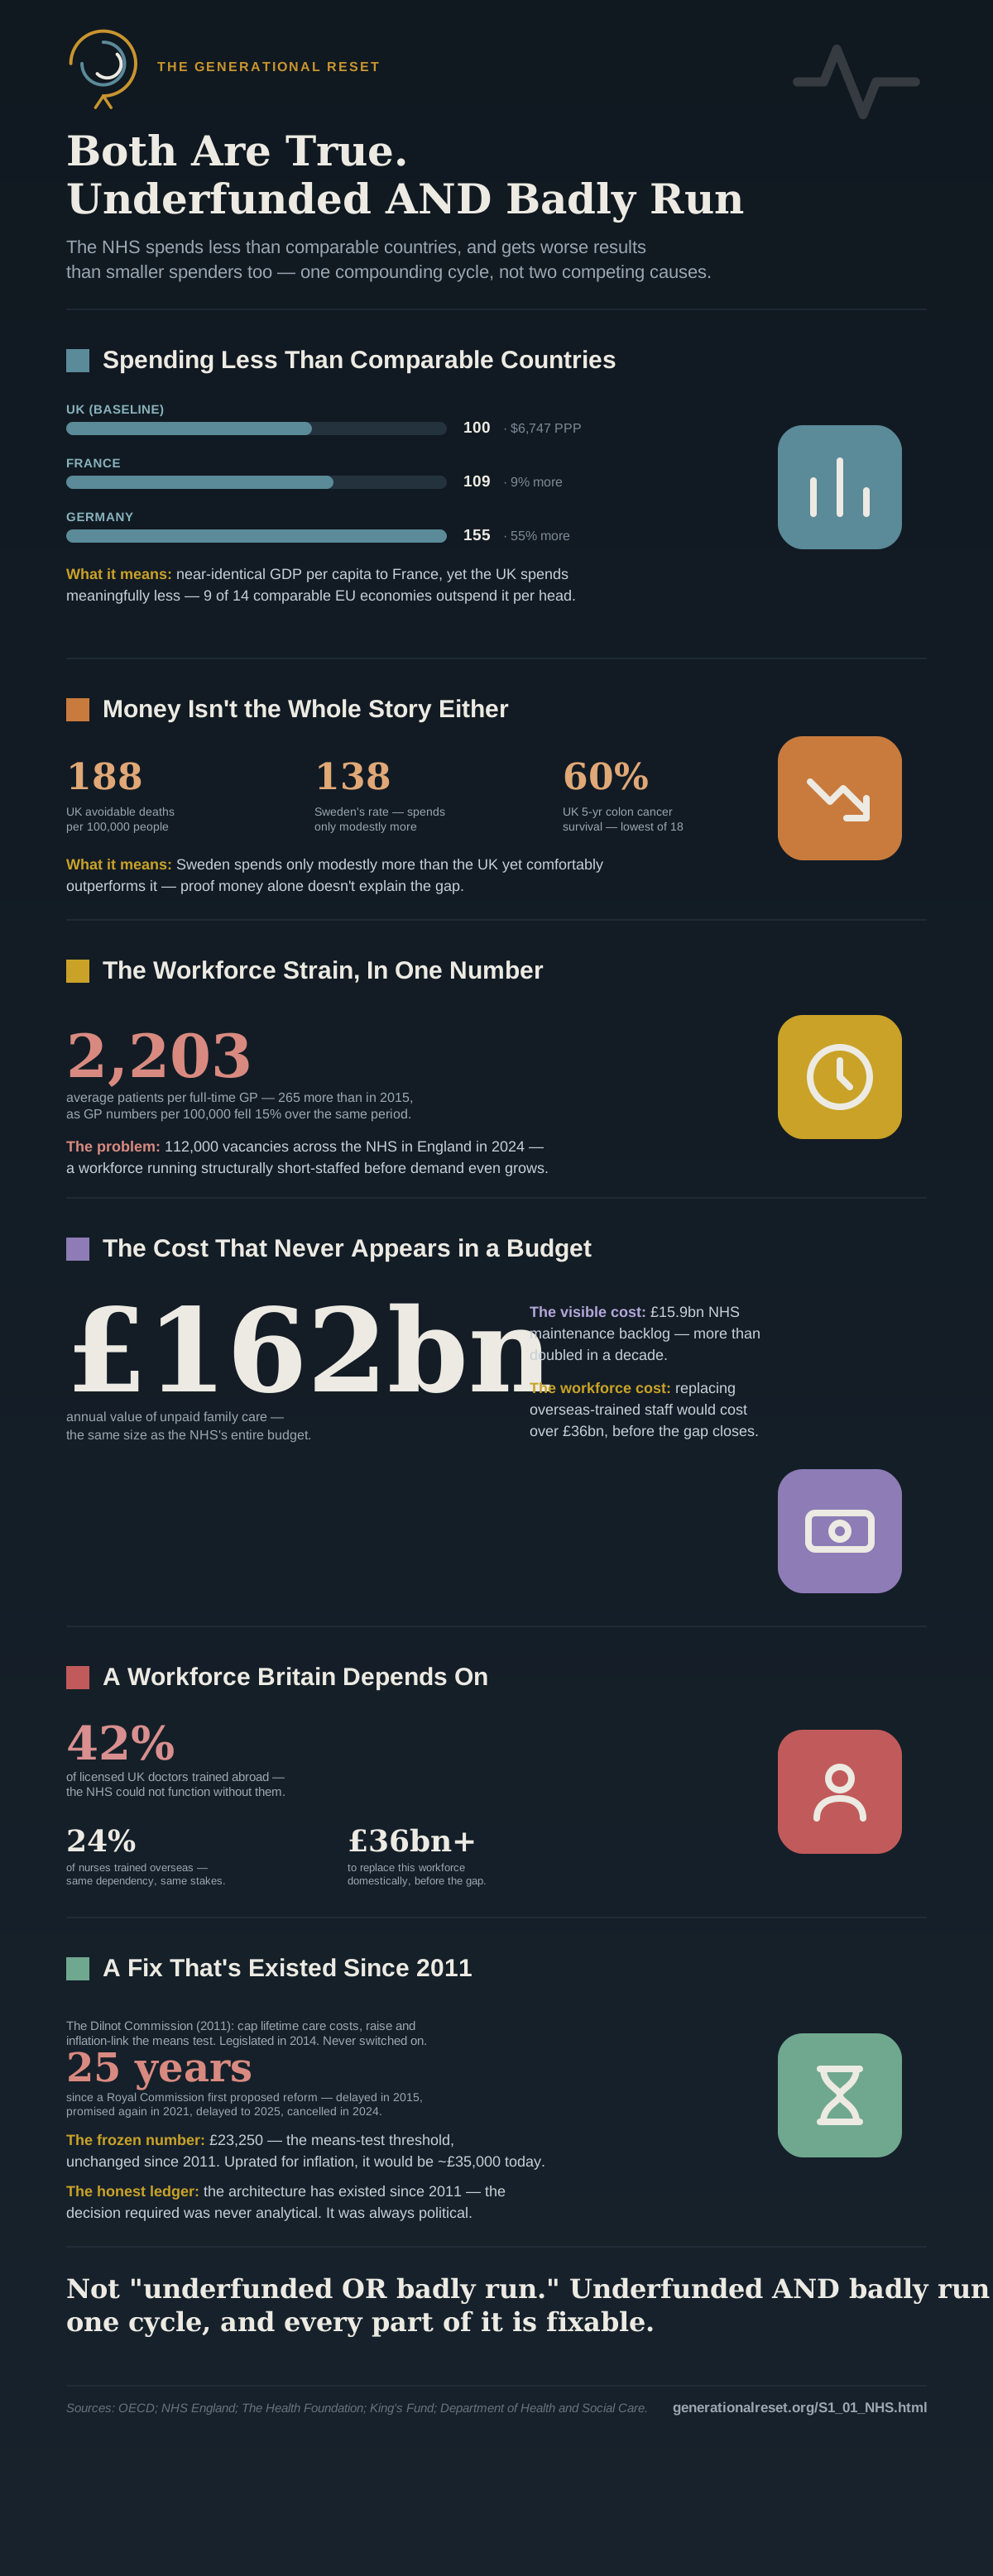
The international data shows the underfunding clearly. France, with similar GDP per head, spends about 6% more per person on health ($7,433 against the UK's $7,008 at purchasing-power parity in 2024). Germany spends 45% more per person through government and compulsory insurance funding, and about 37% more in total.1 Nine of the fourteen comparable EU economies spend more per head than the UK. The UK's capital investment in health ranks near the bottom of the OECD. These gaps add up to the backlog, the waiting lists, the crumbling buildings, and the IT systems that cannot talk to each other.
But underfunding is not the whole story, and the evidence has to be faced. Sweden spends around 13% more than the UK and does consistently better on avoidable deaths and cancer survival. Germany spends far more and gets middling results. The UK spends mid-table and gets below-table results, which means some of the failure lies in how the system is run, not just in how much it gets.
Both are true at once: the NHS is underfunded and it underperforms. Political debate treats these as rival explanations. In fact each makes the other worse. Capital starvation causes inefficiency. Inefficiency wastes resources. Wasted resources build political resistance to further investment.
In 2024 the UK spent about 6% less per person on health than France, a country with similar GDP per head ($7,008 vs $7,433 at purchasing-power parity), and Germany spent 45% more than the UK through government and compulsory schemes.1 Yet Sweden, which spends only about 13% more than the UK, consistently outperforms it: UK avoidable mortality was 200 per 100,000 in 2024 against Sweden's 123, and UK five-year colon cancer survival (60%) is second-lowest among 19 high-income comparators.2
Money alone doesn't explain the outcomes gap; Sweden rules that out. But inefficiency doesn't explain it alone either. UK capital investment in health ranks near the bottom of the OECD, leaving a £15.9bn maintenance backlog3 and IT systems that cannot share records in 9.1% of patient interactions. The connecting argument is this project's own, not a finding any single source states: capital starvation causes inefficiency, inefficiency wastes the money that is available, and that waste then feeds the political case against funding the system properly. It is one cycle feeding itself, not two separate failures.
The causation above fits several responses, not only this pillar's. One is to fund the current model to French levels without reform. Another is to reform the system without much extra money, which this pillar's opening rejects. A third is to move from general taxation toward a social insurance model like France's or Germany's, an option this pillar discusses directly and finds the evidence mixed on.
Choosing to fund and reform at the same time, while keeping general-taxation funding and care free at the point of use, rests on a value judgement this pillar makes openly rather than claiming the evidence settles it: removing the cost barrier to care matters enough to defend general taxation as the funding route, even though this pillar's own data shows France's different model gets better outcomes per pound. A reader who puts more weight on the efficiency of the funding model than on universal, barrier-free access is not wrong on the evidence. They are weighing the same facts against a different value.
Raise per-person health spending toward French levels over a defined parliamentary term, and at the same time fund the reforms set out elsewhere in this pillar: social care, staff retention, procurement and IT. The theory is that funding alone, or reform alone, would each fail to break the cycle. The falsification test below sets out what would show this combined approach isn't working.
2. What the NHS Actually Is: The Steel Man
Made in full, the case for the NHS is stronger than the usual talk of crisis allows. Before naming what has gone wrong, its achievements deserve stating.
2.1 The Founding Principle Remains Correct
Healthcare free at the point of use, available to all regardless of income, is one of the most civilised commitments a society can make. No other design so completely removes cost from the decision to seek medical help. The NHS consistently ranks highly on equity and access in international comparisons, including those of the often critical Commonwealth Fund.4 The cost barrier that deters patients in the United States, the upfront payments French patients make, and the co-payments German patients have faced for GP visits do not exist in Britain. That is a real achievement.
2.2 Clinical Excellence
The NHS has areas of clinical excellence that match any health system in the world. Its trauma care is among the best anywhere; the Major Trauma Centre network has cut deaths from serious injury. Its organ transplant programmes, specialist cancer centres, and infectious disease response, seen most clearly during COVID-19, reflect capability built over decades. The COVID-19 vaccination programme was one of the most successful mass public health operations in the world. In early 2021 the UK vaccinated adults faster than almost any other large country, using the NHS's existing infrastructure and patients' trust in their GPs. A system of fragmented insurers and competing providers would have struggled to match that speed and scale.
2.3 The Workforce That Carries It
1.55 million people work in the NHS, the largest employer in Europe. Most chose their profession out of a commitment to care. Two decades of real-terms pay restraint, impossible workloads and paperwork have drained that commitment, but not exhausted it. The international workforce is part of this asset: 42% of licensed doctors trained abroad5, as did 24% of nurses6. Their contribution can be counted in millions of patient contacts, and seen in the culture of the institution.
2.4 The NICE Model
The National Institute for Health and Care Excellence is a world-class institution. It makes explicit, evidence-based, public decisions about which treatments the NHS will fund, using the Quality-Adjusted Life Year as a standard measure of benefit. Its methods have influenced health technology assessment bodies across Europe. It shows what the NHS can achieve when an institution has clear authority, a defensible method, real power to decide, and independence from short-term political pressure.
3. The Funding Reality
3.1 What the UK Actually Spends
NHS England's budget in 2024/25 is approximately £165 billion. Including Scotland, Wales and Northern Ireland, total UK public health expenditure reaches approximately £242 billion. As a share of GDP, the UK spends 11.1% on health in total, close to France (11.3%) and above the Netherlands (10.1%).1 But that headline hides an important difference. UK spending goes overwhelmingly on day-to-day costs such as wages, drugs and consumables, while its capital investment is near the bottom of the OECD. Systems that invest steadily in buildings and equipment do not build up a £15.9 billion maintenance backlog3, or run IT so fragmented that in 9.1% of patient interactions the hospital has no access to the patient's previous records.
3.2 What the Gap Produces
The gap between the UK and its peers shows up in outcomes. Avoidable mortality, meaning deaths that timely healthcare or prevention should have stopped, was 200 per 100,000 people in the UK in 2024, against 123 in Sweden.2 The UK's five-year colon cancer survival rate is 60%, among the lowest of comparable high-income countries. These are not small statistical differences. At Sweden's rate, the UK would see tens of thousands fewer avoidable deaths each year.
4. The Workforce Crisis
4.1 The Numbers
The NHS in England had 97,475 vacancies at 31 March 2026, a vacancy rate of 6.5%, down from 100,114 a year earlier.7 England had slightly fewer fully qualified full-time-equivalent GPs in August 2026 than in 2015, while the number of registered patients rose by about six million, so the average GP now has 2,160 patients, 222 more than in 2015.8 The Long Term Workforce Plan, published in 2023, recognised the scale of the problem. The government has since promised a refreshed ten-year workforce plan, but by mid-2026 it had been delayed and was neither published nor funded.
4.2 Dependence on International Recruitment
42% of licensed doctors in the UK qualified abroad5, and 24% of nurses trained overseas.6 Around 66% of new doctors joining the register in 2024 were internationally trained. The NHS could not function without them. Replacing the overseas-trained clinical workforce with UK-trained staff would cost about £22.6 billion in medical training alone, plus about £14.1 billion for nurses. That combined sum is more than 20% of the annual NHS England budget, before counting the decade it would take to train them, during which the system would face severe shortages. The immigration debate about the NHS consistently ignores this arithmetic.
4.3 The Retention Crisis
The leaver rate has averaged 11% a year since 2011, and more than half of leavers resign voluntarily. In the 2024 NHS staff survey, 41.6% of staff said work-related stress had made them unwell in the past year, and 30% felt burnt out because of their work.9 Training more people into a system that loses 11% of its staff each year will not close the gap. It fills one end of a leaking bucket at great expense. Working conditions, paperwork, pay and career development have to be fixed at the same time as training expands.
Fund the Long Term Workforce Plan with named, verified milestones, not aspirational targets. Expand clinical placement capacity before increasing student numbers. Treat retention as seriously as recruitment: publish attrition targets annually, with accountability for the working conditions that drive them.
5. Social Care: The Failure Behind Other Failures
Social care is a major cause of the NHS's problems, not a separate issue. Unlike most of the failures described here, which come down to how money is spent or how the system is run, the social care failure is mainly one of political will, repeated by every government of every party for more than a quarter of a century.
5.1 The NHS Impact
In September 2026, an average of 13,647 patients a day were still in hospital although they were medically fit to leave, about one in seven of the general and acute beds in use; in the worst-affected trusts it was close to one bed in three.10 About two-thirds were waiting for the next service, such as a care home place, home care or community health support, to be arranged or to become available.10 The Your Area section of the Me page shows the figures for your local hospital trust. The direct cost of these delayed discharges has risen from an estimated £1.89 billion in 2022/23 to £2.7 billion in 2025/26, up 7.5% on the year before.10 Those beds mean cancelled operations, longer waiting lists, and hospital capacity used by people who should be in care homes or at home with support.
5.2 The Funding Reality
Between 2010 and 2023, local authority spending on adult social care grew by 12.3%, about 1% a year, far below inflation. The Health Foundation's REAL Centre models two funding scenarios. Meeting rising demand alone leaves a gap of £8.3bn by 2032/33. Meeting demand while also improving access and paying the full cost of care leaves a gap of £18.4bn.14 Median care worker pay in the independent sector was £12.00 an hour in March 2025, 56 pence above the National Living Wage. In 2023/24, 8.3% of social care posts were vacant15, about 131,000 vacancies and roughly three times the rate in the wider economy.
5.3 The Political History
Tony Blair's government set up the Royal Commission on Long Term Care in 1997. The Dilnot Commission reported in 2011. The Care Act 2014 legislated a version of its reforms. Implementation was delayed in 2015, promised again in 2021, delayed to 2025, and cancelled in July 2024. The means-test threshold has been frozen at £23,250 since 2010/11; uprated for inflation it would be about £35,000. Care now costs an average of £5,000 a month. The politics of this failure are simple: social care reform costs money up front, and its benefits are spread across several departments, many years and several elections.
A national funding framework for social care, moving it out of local authority means-testing into a nationally funded entitlement available to all, with a cap on lifetime care costs, a means-test threshold raised and indexed to inflation, and a minimum fee rate set nationally. The Dilnot framework is the right design. It has been identified, agreed and legislated for more than a decade. What is missing is a political decision, not more analysis.
6. Immigration and the NHS: What the Data Shows
The claim that immigrants are a burden on the NHS is one of the most persistent and least evidenced in British public life. The evidence covers three things, demand, fiscal contribution and workforce, and all three point the same way.
6.1 Demand
The most comprehensive analysis found that migrants use inpatient hospital services around half as much as UK-born residents of the same age and sex in the years after they arrive. Health tourism, meaning people coming specifically to use the NHS without paying in, was estimated to cost about 0.3% of annual health spending. 32% of UK adults believe immigrants use NHS services more than people born here, and 70% believe immigrants put extra pressure on the NHS. The evidence consistently shows the opposite.
6.2 Fiscal Contribution
Migrants on work, family or study visas pay the Immigration Health Surcharge, £1,035 per person per year since February 2024. The government raised £1.7 billion from the surcharge in 2023/24 and £6.9 billion since 2015.16 Migrants in work also pay income tax and National Insurance. The OBR projects that higher net migration leads to lower deficits and debt, mainly because migrants are more likely to be of working age and paying in.
6.3 Workforce
42% of licensed doctors in the UK qualified abroad, and 24% of nurses trained overseas. Replacing them with UK-trained staff would cost over £36 billion in training, before counting the decade-long gap in supply. A restrictive immigration policy would leave the NHS worse off in health terms. Immigrants are not heavy users of care; the problem is that losing the workforce would cut the system's capacity to treat everyone.
7. Private Healthcare: The Exit Argument
Private healthcare in Britain is mostly a workplace benefit, not a consumer choice, so who gets it depends on employer, sector and seniority rather than preference or medical need. In 2024, 7.6 million people held private medical insurance, up from 6.7 million in 2020. 4.8 million were covered through employer schemes, the highest in more than 30 years of records. Health insurers paid out a record £4 billion in claims in 2024. The industry's own explanation: businesses say they can no longer rely on the NHS to keep their employees healthy.
The argument is this. When the people with the most political voice (senior professionals, business owners, well-connected employees) can partly leave the public system, the pressure to improve it weakens. They still pay the taxes that fund the NHS, but they use it less and so have less personal stake in how well it works. The Education pillar identifies the same pattern in private schooling: when the influential partly opt out, the pressure for improvement that their full presence would create falls away.
The Generational Reset does not propose banning private healthcare. It proposes removing the tax advantages that subsidise it, namely corporation tax deductibility of employer premiums and the absence of employee National Insurance on the benefit, and reinvesting the revenue in NHS capacity. The best case for the current arrangement is that employer healthcare reduces demand on the NHS and keeps people in work. Our answer is that this benefit goes mainly to higher earners while the NHS gets worse for everyone else.
8. Procurement and IT: The Infrastructure of Failure
8.1 Procurement
The NHS is one of the largest buyers in the world, spending roughly £8 billion a year on medical equipment and consumables alone. In theory that gives it huge negotiating power. In practice it rarely uses it. NHS Supply Chain, the central purchasing body, handled about £4.5 billion of that spending in 2022-23; trusts spent more than £3 billion outside it, often paying different prices for the same products. The Department of Health estimated that putting 80% of trusts' purchasing through Supply Chain would save £2.4 billion over five years.17
8.2 IT and Electronic Patient Records
NHS trusts can choose from 40 approved electronic patient record suppliers, and the systems often cannot talk to each other. On more than 11 million occasions, 9.1% of all patient interactions, patients arrived at a hospital using a different record system from their previous one. Clinicians cannot see earlier test results, medication histories or diagnoses. Tests are repeated and mistakes are made. Clinicians spend nearly 30% of their working hours navigating fragmented systems rather than seeing patients.
8.3 NICE: The Exception That Proves the Rule
NICE has what the rest of NHS procurement lacks: clear authority, a method it can defend in public, real power to say no to suppliers, and independence from short-term political pressure. The December 2025 pharmaceutical pricing deal is a warning. Under pressure from the US government and the pharmaceutical industry, it raised NICE's threshold from £20,000–30,000 to £25,000–35,000 per quality-adjusted life year, and the US government said the UK would pay 25% more for new medicines.18 An institution whose independence depends on political protection can lose it.
Establish a statutory independent NHS Procurement Authority with real power to set and enforce purchasing standards across trusts. Protect NICE's independence on method explicitly in legislation: future threshold changes must come from a transparent review of the evidence on NHS opportunity cost, not from commercial or political bargaining.
9. Counter-Arguments
'The NHS just needs more money; reform is a distraction'
Underfunding is real and well evidenced. But the international evidence does not show that money alone closes the gap. The UK already spends 11.1% of GDP on health, close to France and above the Netherlands. The outcomes gap reflects inefficiency as well as too little money, and both have to be fixed. Treating reform as opposition to investment misreads the argument.
'Reducing immigration will free up NHS capacity'
The data does not support this. Migrants use NHS services at roughly half the rate of UK-born residents in their first years here. They pay the Immigration Health Surcharge, income tax and National Insurance. They make up 42% of licensed doctors and 24% of nurses. Cutting immigration sharply would reduce NHS capacity overall, because the loss of staff would outweigh the fall in demand. It would make waiting lists worse, not better.
'A social insurance model would work better than tax funding'
The evidence on social insurance models is mixed. Germany spends about 37% more per person than the UK and gets middling outcomes. France gets better outcomes but with significant administrative overhead and patient co-payments. The founding principle, free at the point of use, is worth protecting. How to fund it is a fair open question. What is clear is that any funding model able to deliver enough money would be better than the current political cycle of underfunding.
Cross-Pillar Dependencies
| Pillar | Connection |
|---|---|
| Political Renewal | The five-year political cycle is the main reason social care reform has failed for 25 years. Political interference with NICE thresholds, and GP workforce targets missed without consequence, both come from political incentives the Political Renewal pillar addresses. PR and the longer horizons of coalition government would lengthen the time horizon of NHS investment decisions. |
| Public Office Covenant | MPs and ministers with private healthcare interests set NHS policy, NICE thresholds and private-sector regulation, a conflict of interest built into the system. Mandatory financial disclosure makes these interests visible and politically costly, changing behaviour without needing proof of intent. |
| Education | CAMHS reform and a larger child mental health workforce are needed before the Education pillar can deliver its commitment of a mental health practitioner in every primary school. The health system must supply the staff; schools provide the point of access. Health visitor numbers are an NHS workforce problem with direct consequences for education. |
| Welfare | The disability caseload cannot fall without clearing NHS waiting lists. In 2024, NHS waiting lists in England held 7.6 million cases, covering about 6.4 million people. People who wait years for treatment cannot work, and claim disability benefits while they wait. The OBR and IFS have both identified clearing waiting lists as one of the most cost-effective long-run welfare savings available, not because it removes entitlement but because it treats the condition that stops people working. |
| Economy | Low wages and insecure work are major drivers of the health outcomes gap, the mental health crisis and preventable hospital admissions. The wages and work compact is also health policy. The NHS workforce crisis is itself partly a failure of wages and working conditions that the Economy pillar's wage reforms are needed to fix. |
| Housing | Housing is a major social determinant of health. The mental health effects of insecure housing, the developmental harm to children in temporary accommodation, and the physical effects of cold, damp and overcrowded homes all create NHS costs that housing reform would prevent. 151,630 children in temporary accommodation (March 2024) is an NHS demand problem as well as a housing one. |
| Public Debt | The £15.9 billion NHS maintenance backlog adds directly to the long-run debt path. The health costs of an ageing population are the largest single driver of the OBR's long-run debt projection. Reform that shifts the NHS toward prevention and slows demand growth is essential to long-run fiscal sustainability. |
| Criminal Justice | Police chiefs estimate that officers spend just under a million hours a year waiting in hospitals with people in mental health crisis. The most quoted national figure, from 2002, found that 72% of sentenced male prisoners had two or more mental health disorders; it is old, and no national update has been found. NHS mental health capacity feeds directly into criminal justice. The justice system cannot reduce reoffending driven by untreated mental illness unless the health system tackles its causes. |
| Energy | The NHS estate is one of the largest energy users in the public sector. Energy efficiency investment in NHS buildings links the Energy pillar's net zero programme to cutting both the NHS maintenance backlog and its running costs. |
11. Proposals for Change
These are the evidence-based proposals of this pillar, put forward for public discussion and challenge. They are not a programme for government. They are the case the evidence supports.
-
P1 Fund the NHS properly: raise per-person health spending toward French levels over a defined parliamentary term, with a published trajectory, independent verification of progress, and a clear account of what the funding gap currently costs in patient outcomes.
-
Bring social care into a national funding framework: legislate a cap on lifetime care costs, raise and index the means-test threshold, set minimum fee rates nationally, and fund the transition through a hypothecated social care levy. The Dilnot design is ready. What is needed is a political decision.
-
Fund the Long Term Workforce Plan with named, verified milestones. Expand clinical placement capacity before increasing student numbers. Publish annual retention targets with accountability for working conditions.
-
P4 Fix the GP system: extend minimum consultation times, fund the move away from the collapsing partnership model, and greatly expand Pharmacy First as a real first point of contact.
-
Establish a statutory independent NHS Procurement Authority with real power to set and enforce purchasing standards, ending the current position of responsibility without authority.
-
Protect NICE's independence in primary legislation, so future threshold changes come through transparent evidence review, not commercial or political pressure.
-
Invest in NHS IT so systems can share records: open standards, electronic patient records everywhere with data sharing, and a funded plan to cut the 30% of clinical time spent navigating fragmented systems.
-
Remove the tax advantages that subsidise employer-provided private healthcare (corporation tax deductibility of premiums and the absence of employee National Insurance on the benefit; employers already pay Class 1A NI on it) and reinvest the revenue in NHS capacity. Not a ban, a level playing field.
-
Publish an annual NHS performance report to Parliament that compares UK outcomes with peer systems, tracks progress against stated commitments, and names the gap between political promises and what the service delivers.
Whether universal healthcare free at the point of use is the right commitment is settled; it is. The open question is whether Britain has the political courage to fund it, fix it, and tell the public the truth about what it costs and what it delivers. The evidence in this pillar says it can. The last twenty-five years say it has not.
The Generational Reset is a non-partisan, public-interest project. It is not affiliated with any political party, does not accept corporate funding, and publishes all its work under open licence for public discussion and adaptation.
For public discussion. Not affiliated with any political party. | generationalreset.org
The Generational Reset | S1_01: The National Health Service | For public discussion. Not affiliated with any political party. | generationalreset.org